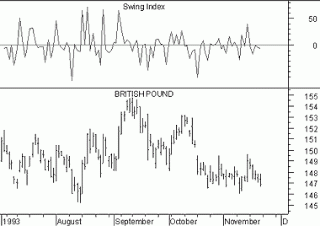
In an index value plot, data is plotted relative to an index. Here we see the change in value of the British Pound over a time period, and above that charge an index value plot where the swing of value is plotted against a 0 index, departures appearing both as positive and negative values.

No comments:
Post a Comment